Google Analytics is great for showing you data about your website’s users and how they navigate and interact with your website, but it’s not so straightforward finding out the “why” behind that behaviour. That can feel especially the case when users aren’t behaving how you’d expect them to.
You may find yourself asking questions like “Why aren’t more users converting?” or “Why is there such a sudden drop-off of users on this page?”
While looking at things like visual recordings or heatmaps (using a tool like HotJar) can certainly help with some aspects, another thing to consider is whether or not your users are experiencing errors in their browser that are impacting on the functionality of your website.
We’re talking about Javascript errors and this is a guide to surfacing the errors that your users are experiencing so that you or your developer can investigate further to understand how significant the impact is and take action.
Configure Google Analytics
You have three main options when it comes to recording the JS errors in Google Analytics:
- Create a new Property (this is recommended)
- Use an existing Property, but create a new View and filter the Events out from the other Views in the Property
- Use an existing Property and View(s) (no configuration needed)
Bearing in mind that Google Analytics has a limit of 500 hits per user session and that sometimes Javascript errors can repeat a number of times, the last thing you want to do is to miss out on valuable user behaviour tracking across your site because a rogue JS error has sent hundreds of hits.
Creating a New Property
With that in mind, my recommendation is to create a new Google Analytics Property to keep the data separate. If you go this route, there’s also some additional setup in Google Tag Manager which we’ll cover later.
Use an Existing Property but a New View
If you don’t have the required permissions to do that, or you don’t think it’s necessary, you can just create new View in your existing Property instead. If you go this route, you may want to add a filter to your other Views to remove the JS error Events to keep it cleaner.
Note: the JS errors will still count towards your 500 hit limit even if you add a filter because the data gets filtered after it’s collected by Google Analytics.
Using an Existing Property and View
Alternatively, you can just send these Events to your existing Views which will require no extra configuration.
Setup JS Error Tag in Google Tag Manager
With your chosen Google Analytics configuration ready, it’s now time to setup the Tag in GTM that will send the Javascript error information to Google Analytics as an event.
Additional Setup if Using a New GA Property
If you went for the first option in the GA configuration section above, then this is for you. If not, you can skip this part.
As we setup a new Property, we need to do a number of things first in order to get the new Javascript error reporting Tag to work:
- create a new Google Analytics Settings Variable for your new Property (using its UA ID)
- create a new Tag to fire Page Views to Google Analytics for this new Property using your new Variable
- we’ll get to this later, but use the new Variable in the Tag we’re about to setup
Creating the Error-Reporting Tag
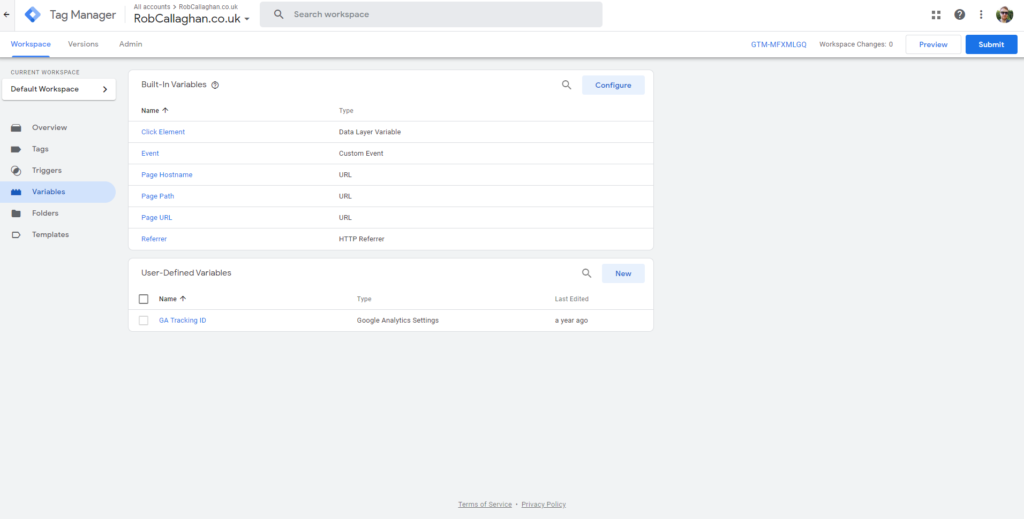
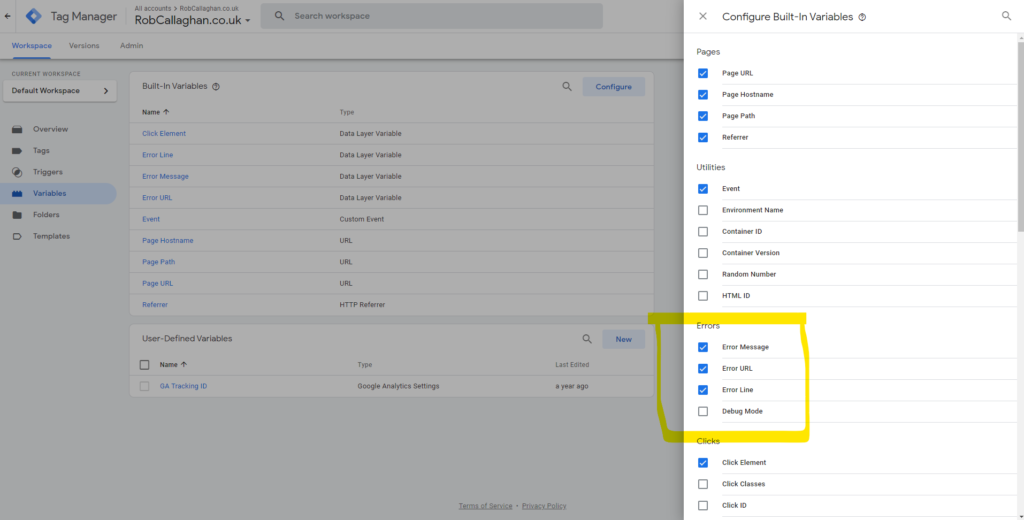
In Google Tag Manager, start by enabling these built-in variables (if they aren’t already):
- Error Line
- Error Message
- Error URL
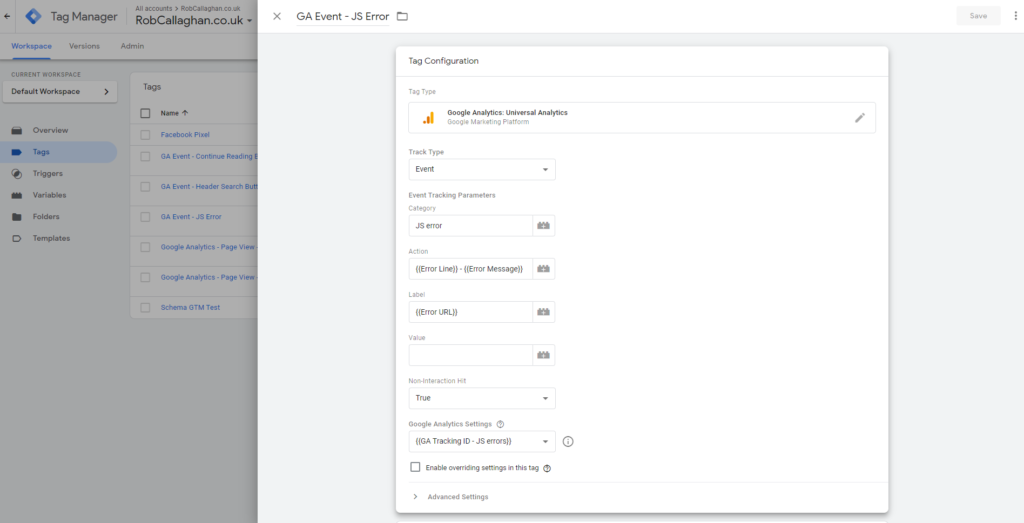
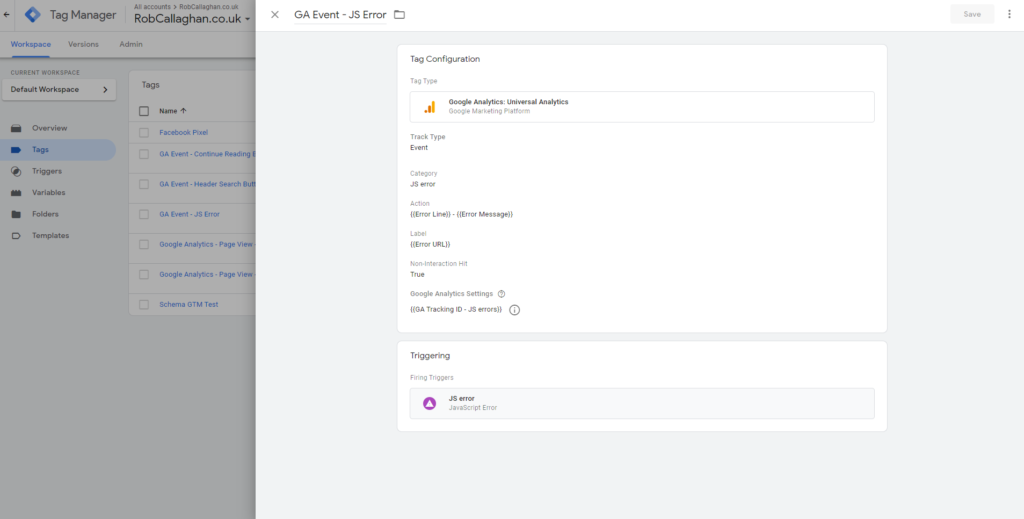
Once that’s done, go to the Tags screen and create a new Tag. Configure the Tag like this:
- Name: GA Event- JS Error
- Tag Type: Google Analytics
- Track Type: Event
- Category: JS error
- Action: {{Error Line}} – {{Error Message}}
- Label: {{Error URL}}
- Non-interaction Hit: True
- Google Analytics Settings: your GA settings variable (depending on the Property you are using)
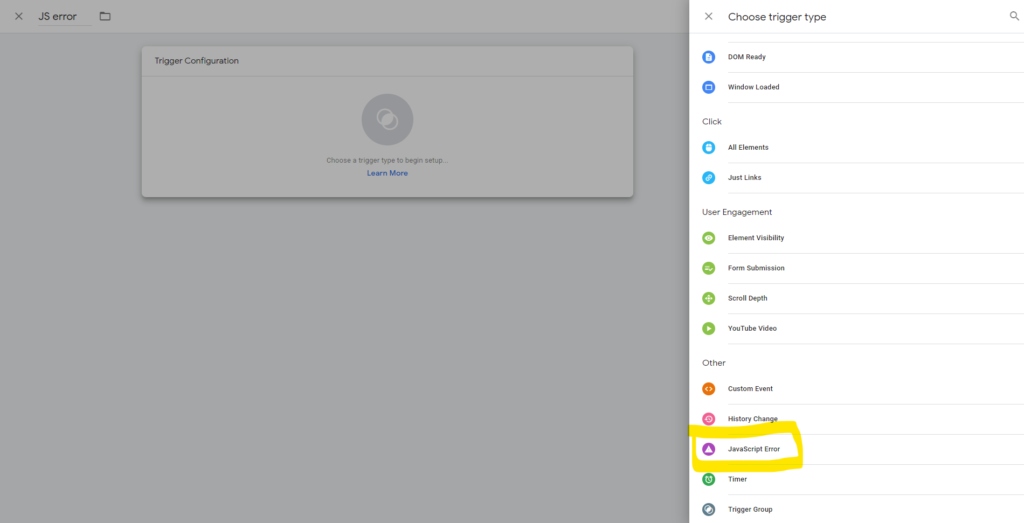
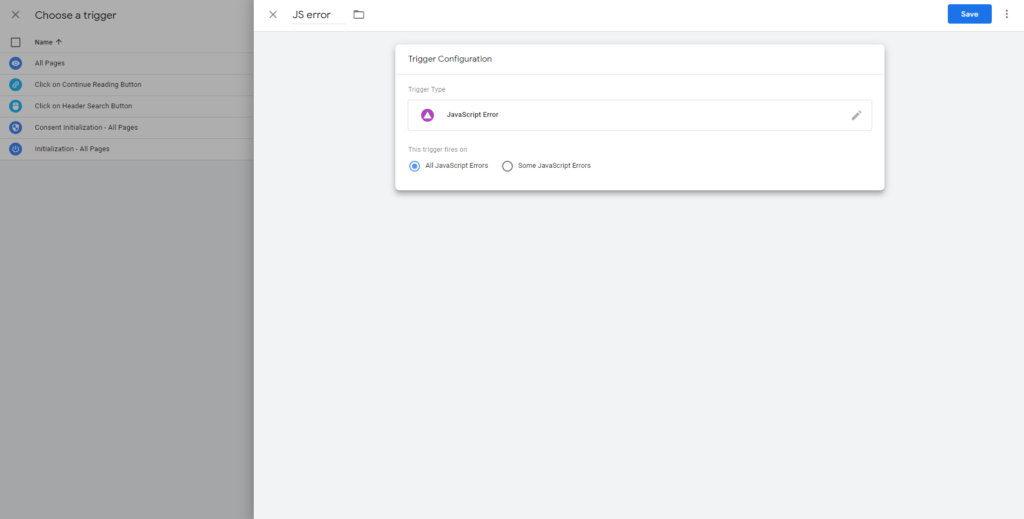
Now we need to create the Trigger. Here, you’ll need to select ‘Javascript Error’ as the Trigger Type and leave it set to ‘All Javascript Errors’. You can name this Trigger something obvious like “JS error”.
When you’re done, add your new Trigger to your Tag. Our final Tag setup will look like this:
Click Save and your tag will be ready to publish, so go ahead and click Submit.
Quick Check to Confirm it’s Working
To see if it’s working, let’s head to our chosen Google Analytics View and go to the Realtime report.
First, navigate to a unique URL on your website (like one that doesn’t exist!) and ensure that your page view hits are showing up in the Overview tab in GA.
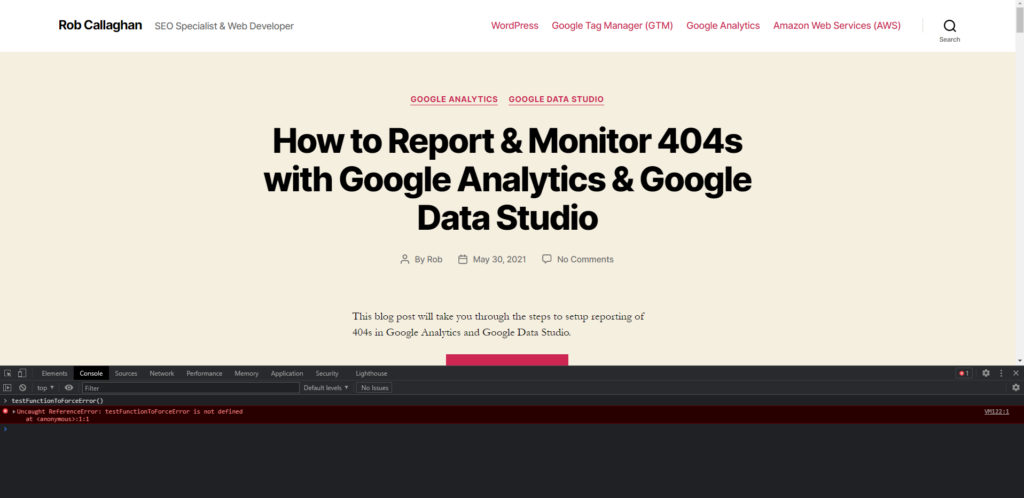
If page views are firing correctly, the next step is to force a Javascript error in the browser’s console.
To do this, press F12 to bring up the Chrome DevTools / Developer Tools. Navigate to the Console tab, and type or paste in the following:
testFunctionToForceError()Then hit Enter and you should immediately see an error showing in red.
Back in Google Analytics, check the Events tab and you should see your error being reported there.
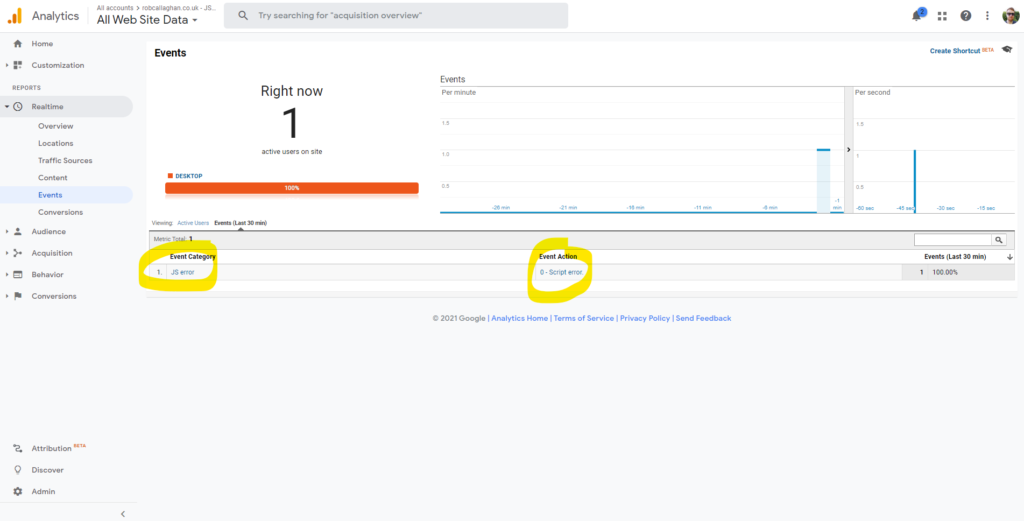
If you check out the Event Label, you’ll notice it’s empty. This is because the Label would typically show us the URL/path of the script where the error originated and in this case we’re just testing by entering Javascript directly in the console of the browser.